• Home
  • Publications
  • Our regions
  • Data
    • Continuum
    • Molecular lines
  • Consortium
  • Contact
  • Internal
ALMA IMF
  • Home
  • Publications
  • Our regions
  • Data
    • Continuum
    • Molecular lines
  • Consortium
  • Contact
  • Internal

ALMA-IMF Core Working Group, July 23 2020

7/23/2020

0 Comments

 
Connection:
https://ufl.zoom.us/j/96368629056?pwd=c1JmbWN6Rll0ZkNjYzJZamtXZFdmUT09

Attendees: Fred, Adam, fab, Gemma, Nathalie, Alex, Tapas, Thomas, Sylvain, Yohan, Jeff, Timea, Roberto
Not attending: Sasha

For memory:
Minutes from last week’s telecon
Members and their main interests


Agenda:
  1. Mass estimates (WG led by Alex & Fred)
 
  • Alex presented his results on W43-MM2&3.
  • Have regridded all images to same pixel grid
    • Potentially an offset between PACS and the other observations, leading to fitting errors - investigating
  • Have applied Zero-Point calibration to PACS by comparison with IRAS and Planck dust model
    • This made an instant improvement to the fitting - probably an issue of absolute calibration
  • Images starting to “look good”, but internal RChiSq values are very high. This is likely do to H2 region or optical depth issues
  • Instead, better to produce “recovered” flux images form PPMAP cube
    • Images look very close to observations - a good sign
    • overestimating B6 flux
    • underestimating 160-500 flux, particularly 350 SABOCA flux. Potentially another absolute calibration issue? (Maybe run with Herschel 350, just to check)
  • Next big step is filtering all images to remove structures too large for ALMA.
   

  • Pending questions and issues:
    • Are 12M+7M and/or 7M-only data data useful? → Yohan will evaluate the filtering scale of 12M, 7M and 12M+7M images investigating power spectrum slopes (see below). Alex will investigate filtering and addition of 0-offsets. Adam will produce rough 7M-only images.
  • Bad equinox of ALMA fits read and treated by Gildas → Fred corrected it in the stitched ALMA data. Nichol proposed to use linearmosic to stitch data.
  • Need to properly evaluate the filtering scale of each image → Yohan started using MnGSeg to plot power spectra and look for slope breaks (see table below).
    •  power spectrum is OK at 1mm but the beam looks larger 0.53’’ (instead of 0.46”) and the filtering scale could be 30’’ (instead of 12”). TBC...
    • power spectrum is bumpy at 3mm. To investigate...
Picture
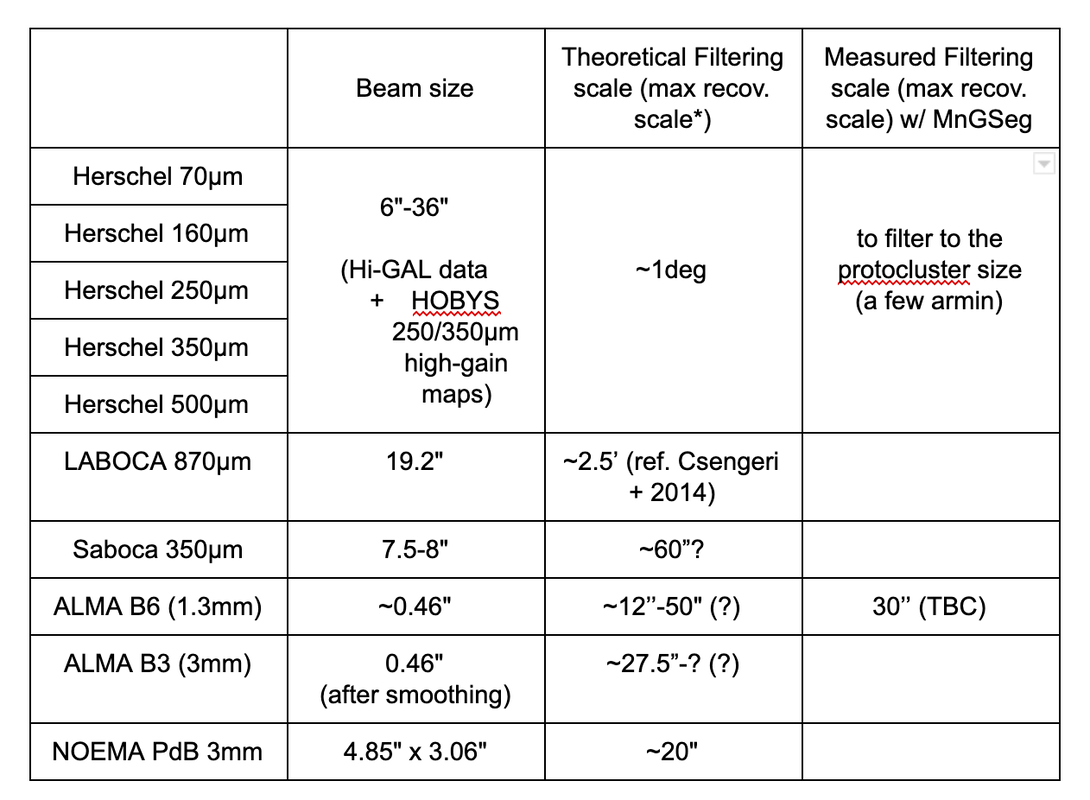
* Max recov. scale = ~0.6 x \lambda/Lmin         See equation nº6.1 (p53) in https://www.iram.fr/IRAMFR/ARC/documents/cycle1/alma-technical-handbook.pdf

  • Free-free contamination level could be estimated from H41a images.
Roberto sent a Drive link to Fabien and Fred with the fits files of the preliminary results (old cubes with bigger beam). At 0-order, it will be used to identify cores lying in the footprint of bright H41a emission of compact HII regions. 
Thomas and Roberto should start investigating how to properly estimate the free-free emission at 1.3mm and 3mm of extracted cores. Who could help them?

  1. News from Core extraction
Sasha: a getsf extraction of sources and filaments for W43MM2MM3 is going on, no issues to discuss. Fabien will soon start extracting sources in all fields.


  1. Improvement of the core extraction strategy of detailed CMF papers
 
  • Tests at the detection step to enlarge the core sample and/or get better flux measurements:
    • Tests using MnGseg to remove the Gaussian noise (cirrus + some interferometric artefacts):
    MnGseg was applied to 
  • the 1mm/3mm images of W43-MM2MM3: 
=> power spectrum is OK for 1mm but beam looks larger 0.53’’ instead of 0.46”, filtering scale of 30’’?), strange bumpy power spectrum at 3mm (to investigate)
  • the synthetic images provided by Sasha (cirrus noise + isolated cores or cores placed on a filament) and by Fabien (projected numerical simulations processed by the ALMA simulator)
 
  • the 7M+12M B6_BSENS image could replace the 12M-only B6_BSENS image. Who could compare catalogs? for which region?
 
  • Tests at the detection step: 
    • Who could investigate an evolved region to check if it provides a good estimate of the free-free component of 3mm and 1.3mm fluxes?
→ Gemma and Thomas could work on W51E...

  • “Pure-continuum” images (with Jordan’s method) will be provided by Nathalie for W43-MM2. What about MM3?
 
  1. Other points regarding core catalogs
 
  • Yohan: I developed a user friendly procedure (python functions very detailed and simple to use) for us to investigate the core catalogs, whether it comes from getsf or a GExt2D (or others but in that case, I need to add this software in my procedures). Everything is written as automatic functions and can be handle using live python session, python script or ideally Jupyter notebooks (more interactive and user friendly) because I also developed jupyter notebooks to read and analyze/compare multiple catalogs at once.
 
  • Pending questions for post-selection of cores: 
  • What do we do about 3mm-only cores? (largest images, 3mm emissivity less well constrained, free-free emission, ??% more sources in W43-MM2&3)


--------------------------------------------------------------------------------------
  1. Temperature estimates
 
  • Who would like to start investigating thermometers like CH3OH, CH3CN, CH3CCH lines? Timea will start on G328. Someone else? Nathalie has begun with W43-MM1 and can go on with W43-MM2&3.
This information cannot be used for the 1st mass estimates we’ll make but we can expect publishing  more corrected core temperature and thus mass measurements in the future.

  • Who could join Brian to help him get ready to ask for more ammonia data? Gemma? others?
Gemma: Yes, I can help with the ammonia data


  •  Some ideas to constrain kappa? Someone interested? 1mm/3mm ratios are sometimes strange, maybe due to hot-core emission… To be investigated
 
  • Fred could present the proxy she proposes for the protostellar luminosity, using the line contamination from COMs.
 
  1. Cores fragmentation/multiplicity (Feasibility to be discussed)
  • Isabelle and Benjamin statistically investigate the fragmentation cascade in Herschel and simulated images. The final goal is to link the multiplicity of cores and the multiplicity of YSOs (as IR detections) and correct CMFs.
  • It requires emission maps sensitive to a large range of scales down to the protostellar binary regime (100 AU). The fragmentation should be investigated at >4 scales separated by a factor of 2, thus over at least a decade. 
  • Questions: 
    • How to add short spacings to continuum ALMA data? Could we use NIKA2, LABOCA, Bolocam data? Shall we use PPMAP to combine them with Herschel data?
    • What high-resolution data could we use? Adam and Patricio have some.
0 Comments


Leave a Reply.

    Archives

    May 2021
    April 2021
    March 2021
    February 2021
    January 2021
    December 2020
    November 2020
    October 2020
    September 2020
    August 2020
    July 2020
    June 2020

    Categories

    All

    RSS Feed

Happily made by Physique & Chocolat
Proudly powered by Weebly
  • Home
  • Publications
  • Our regions
  • Data
    • Continuum
    • Molecular lines
  • Consortium
  • Contact
  • Internal